Audi Q3: Tire Requirements
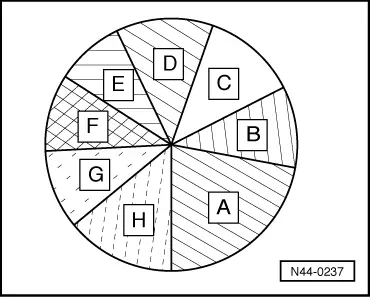
A - Wet braking behavior
B - Comfort
C - Steering precision
D - Driving stability
E - Tire weight
F - Service life expectancy
G - Rolling resistance
H - Hydroplaning
The pie chart represents the tire's performance. It shows how the extent of the demands A through H could be distributed in tire construction and rubber compound.
The improvement of one characteristic leads to the worsening of another one.
Example:
The improvement of wet braking behavior -A- leads to losses in comfort -B-, rolling resistance -G- and service life expectancy -F-.
The service life expectancy of car tires depends not only on the rubber compound and the tire construction. The operating conditions, circumstances specific to the vehicle and the driving style all have a strong influence on the tire's service life.
With modern vehicles and appropriate engines, especially gentle and economical but also extremely sporty driving is possible. Service life of 5,000 to 40,000 km (3,100 to 25,000 miles) and even more is possible.
 Note
Note
Driving style is the decisive influencing factor on the life of the tires.
Tire Service Life, Influences
The following factors influence the service life of a tire in varying degrees.
- Speed
- Brakes
- Acceleration
- Cornering
- Driving Style
- Maintenance
- Tire Pressure
Area:
- Paving
- Exterior temperature/climate
Vehicle:
- Weight
- Tire Pressure
- Dynamic toe- + and camber values
Tire operating conditions
Speed range, wet or dry
Tire construction:
Winter/summer
 Note
Note
Having the correct tire pressure in the tires also influences the life span of the tires.
 Note
Note
Always make sure that the tires are inflated to the correct air pressure.
Maintenance (Tire Air Pressure)
The weight of the vehicle flattens the tire's contact patch. When the tire rolls, this results in deformation all around the circumference of the tread and the entire belt assembly. With low pressure, there is a greater deformation which results in more intense warming and greater rolling resistance. This all results in a greater wear and a greater safety risk.
Example: specified series production tire pressure depending on load on cold tires
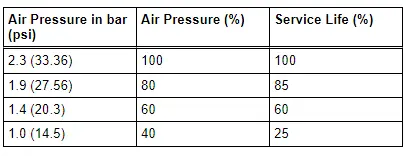
Excessive air pressure leads to greater wear at the center of the tire and reduced rolling comfort. It is recommended always to maintain the air pressure indicated by the manufacturer.
Diagram 1:
Tread depth over service life for vehicles with front wheel drive and V tires.
P - Tread Depth
S - Distance Driven
1 - Front Axle
2 - Rear Axle
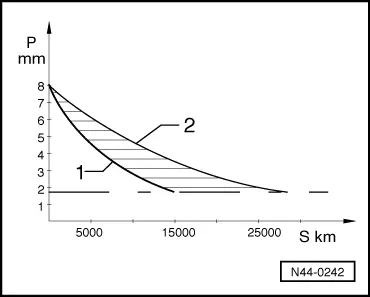
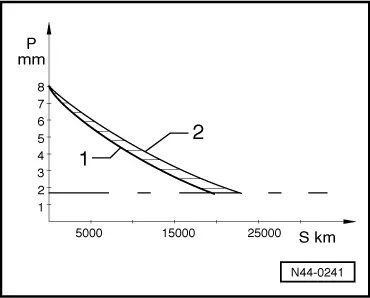
Diagram 2:
Tread depth over service life for vehicles with all wheel drive and V tires.
P - Tread Depth
S - Distance Driven
1 - Front Axle
2 - Rear Axle
 Note
Note
- The diagrams presented cannot be applied in general.
- They only illustrate the wear characteristics on the front and rear axles as well as wear characteristics of front and all-wheel drive vehicles.
- Depending on operating conditions and chassis, the service life that can be attained may deviate substantially.
As can be seen in diagrams -1 and -2, for a given distance, more tread wears off tires with a complete tread than off tires which are quite worn. After the first 5,000 km (3100 miles), no conclusion can be made about the total service life because the wear curve is not linear.
On front-wheel drive vehicles, the front wheels must transmit the major portion of the lateral and braking forces as well as the steering and traction forces. Due to these demands, the front tires on front wheel vehicles wear more quickly than rear tires. Even usage of all tires is achieved by regularly exchanging front and rear tires. Rotating the wheels.
Driving Style
1. Constant driving without deceleration and acceleration.
Example:

2. Brakes
The highest abrasion is achieved when braking.
Example: Braking at 50 km/h.
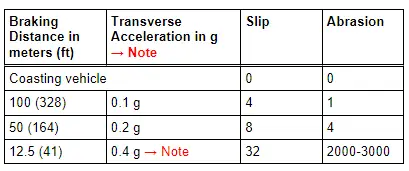
1) g = gravitational acceleration: 9.81 m/s2
2) A deceleration with 0.4 g corresponds to heavy braking.
3. Acceleration (driving style)
The slip that occurs during a gentle acceleration from a stop is approximately the same as the slip that occurs at a steady speed of approximately 100 km/h (62 mph).
Example:

Cornering (driving style)
A sporty driving style and driving at higher speeds also cause greater wear when driving around curves.
In practice, this means doubling the speed in a curve leads to an increased abrasion by a factor of 16. This is the extra charge for driving faster.
Example: Driving around a curve with a radius of 150 m.
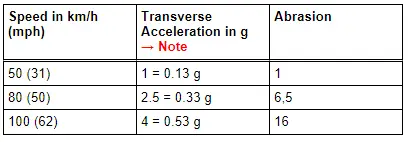
3) g = gravitational acceleration: 9.81 m/s2

